Plotting
Advertisement
3D Grapher v.1 21
3D Grapher is a feature-rich yet easy-to-use graph plotting and data visualization software suitable for students, engineers and everybody who needs to work with 2D and 3D graphs. 3D Grapher is small, fast, flexible, and reliable.
Advertisement
MOPlot v.1.91
MOPlot is a handy visualization application specially designed for fast molecular orbitals plotting from the outputs of the Gaussian 03/98/94, Molcas, Gamess/US quantum chemical calculation packages.
SciDAVis v.0.2.4
SciDAVis is a free software for Scientific Data Analysis and Visualization. User-friendly software for Scientific Data Analysis and Visualisation. SciDAVis is a free interactive software aimed at data analysis and publication-quality plotting.
EasyGraph v.1.0
Easy to Use Data Plotting Application. EasyGraph finally provides a simple, intuitive and fast way for students to learn the art of graph creation, modification and data representation.

STIMATH v.1.0
STIMATH is a high-level tool for mathematics, linear algebra, plotting and expression evaluation that can be used from any programming environment. STIMATH can be used for mathematical functions for linear algebra, statistics, Fourier analysis
Graphe Easy
Graphe Easy is a feature-rich yet easy-to-use 2d-graph plotting Windows program. It allows to draw many graph types (cartesian, polar, parametric coordinates) and many other graphs such as conics, integrals, inequations or sequences. It also provides a
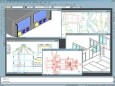
ProgeCAD Viewer DWG
AutoCAD DWG drawing viewer with markup, plotting, rendering, PDF output! High precision measuring, zoom. pan, all the features you need to review your AutoCAD drawings and output them to paper. Easy to use, Helps you reduce cycle time and costly printing

PlotLab VC++ v.5.0.3
PlotLab VC++ is a set of Visual C++ components for very easy and fast Data Visualization. They allow very fast display in a Plot/Scope/Chart or Waterfall form. Great for FFT Visualization! Free for non-commercial use.

PlotLab .NET v.6.0
PlotLab .NET is a set of .NET 2.0-4.5 components for very easy and fast Data Visualization. Allows very fast display in a Plot/Scope/Chart or Waterfall form. Great for FFT or Histogram Visualization! Free for non-commercial use.

PlotLab VCL v.7.0
Delphi/C++ Builder VCL/FMX components library for very easy and fast Data Visualization. Allows very fast display in a Plot/Scope/Chart or Waterfall form. Great for FFT or Histogram Visualization! Free for non-commercial use.
TeeChart Pro v.5 3
TeeChart Pro provides complete, quick and easy to use charting and plotting ActiveX COM and Borland VCL / CLX classes for Business, Real-Time, Financial and Scientific applications.